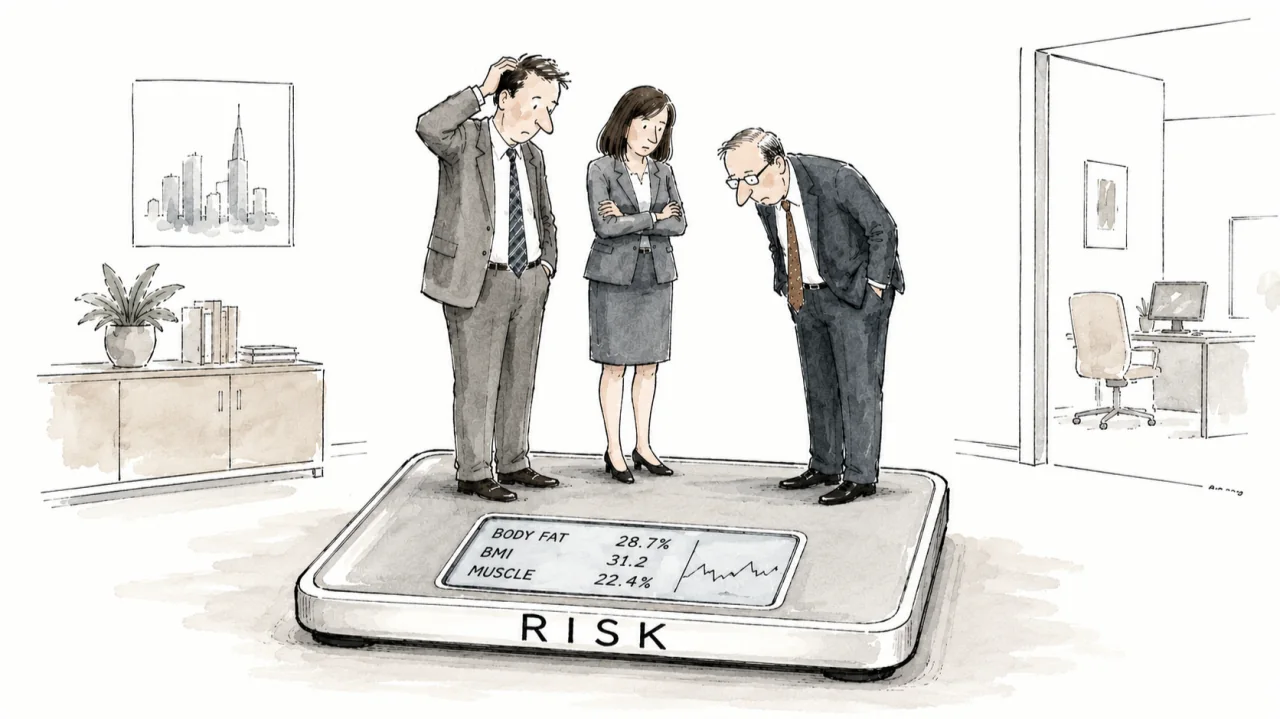
All models are wrong, but some are useful. — George E. P. Box
For about a decade, I owned a bathroom scale that was excellent at exactly one useless thing. Every morning, it handed me a number, precise to the decimal. And every morning, it declined to answer the only question I actually cared about: Am I heading the right way?
A risk register does the same thing to a board.
Every board I've ever briefed asks some version of the same question — is our risk actually going down? — and for most of my career, the honest answer from a register has been a shrug dressed up in color. We have a beautiful spreadsheet. It's red, amber, and green. It has owners, dates, and treatment plans. And it cannot tell you, in a single number, whether the program is working.
I've used the approach below for years to close that gap. I never bothered to write it down. A recent review pushed me to, so here it is — not as a precise model of expected loss (it isn't one), but as a rough, directional instrument that answers the question leadership keeps asking and risk registers rarely answer.
Four steps. And yes — I'm aware that any methodology arriving in exactly four tidy steps should make you a little suspicious. Indulge me.
First, a word about the scale you already own
A risk register is an inventory. Inventories are static by nature — they tell you what exists, not whether you're winning. A bathroom scale tells you that you weigh 212 pounds. It has no opinion on whether that's the good news or the bad news.
Eventually, I replaced that scale with a smart one — the kind that reports body fat, lean muscle, visceral fat, and a BMI alongside the weight. The number on its own had been quietly lying to me for years, and I didn't know it. That upgrade is the whole point of what follows: we're going to take a register that only knows how to report total weight and teach it to read composition.
Worse, most registers suffer from quiet inflation. Everything drifts toward High because nobody was ever fired for overstating a risk, and because some organizations literally instruct assessors to default inherent risk to High. Once everything is High, the register loses the one signal that matters: the difference between where a risk started and where your controls left it.
So before any of the math below, there's a non-negotiable first step — calibrate the scale:
🔹 De-inflate the register. Make inherent scores reflect a credible worst case, not a reflexive maximum. 🔹 Ground the residual. Make residual scores reflect the controls that genuinely exist — not the ones you wish you had.
Every metric that follows is only as honest as the register beneath it. Weigh yourself in a winter coat, and the scale isn't lying, exactly — but it isn't telling you anything either. Skip this step, and you won't measure risk reduction. You're measuring your own optimism.
Step one: turn the register into a number
Score each risk the ordinary way — Likelihood × Impact, on a 1–25 scale — but do it for three states:
🔹 Inherent — the risk before controls (your starting weight). 🔹 Residual — the risk with today's controls (where you are this morning). 🔹 Target — where your plan intends to land (your goal weight).
Sum each column. Say a register comes out to 280 inherent, 175 residual, 100 target.
On its own, "175" is meaningless — it's an ordinal score, not dollars. But the movement is not meaningless at all. That gap between where you started and where you stand is the entire point. It's the raw material for everything else.
Step two: anchor it to a ceiling — and use two
To turn a sum into a percentage, you need a worst-case denominator. I use two, because each one can be gamed in a different direction, and reporting both keeps everyone honest.
🔷 Band-ceiling (my primary): peg each risk to the top of its inherent band — a Medium counts as 10, a High as 19, a Critical as 25 — and sum those. Conservative, project-relative, and it reflects this register's own worst case. 🔷 Absolute (reference): every risk counts as 25, the theoretical maximum. Fixed and comparable across very different registers.
Here's the catch, said out loud: the absolute denominator can be gamed by padding the register with cheap, low-severity risks — each one barely moves the numerator but inflates the denominator, so your "percent of maximum" looks better while nothing improved. The band-ceiling denominator can be gamed the other way, by inflating inherent ratings.
This is exactly why calibration comes first, and exactly why I never report a single denominator.
Step three: grade the reduction, not the level
This is the part people miss — and it's the whole game.
Most scorecards grade the residual level: how much risk remains. Useful, but it quietly rewards starting low. The person who has weighed 180 his entire adult life gets the same flattering number as the person who fought from 280 down to 180 — and one of them did all the work.
I'd rather grade the work. How much risk did your controls and your plan actually remove, measured from the starting line?
Reduction = (Inherent − State) ÷ Inherent
Then grade it on an inverse scale — more reduction earns a higher grade:
🔹 65% or more → A 🔹 50–64% → B 🔹 35–49% → C 🔹 20–34% → D 🔹 Under 20% → F
With the illustrative numbers above, today's controls deliver (280 − 175) ÷ 280 ≈ 37% → C, and the plan targets (280 − 100) ÷ 280 ≈ 64% → B.
Two deliberate design choices are worth pausing on:
🔷 A perfect score is impossible by construction. Residual risk never reaches zero, so you can't reduce 100%. An A reflects a strong, achievable reduction — not perfection. That honesty matters when you're standing in front of people who can smell a rigged metric from across the boardroom. 🔷 The grade is only meaningful on a calibrated register. Because reduction is measured from an inherent baseline, an inflated baseline manufactures fake progress out of thin air. The cure for gaming the metric is the same as the prerequisite: score honestly and lock it to your framework.
Step four: never let the average hide the outlier
Here's where the dumb scale finally fails you, and why I eventually paid for the smart one. Two people each lose ten pounds. One burned off fat. The other lost lean muscle — lighter on the readout, weaker in every way that counts. The bathroom scale records both as minus ten and feels equally good about both. Losing ten pounds of fat and losing ten pounds of muscle are not the same event, and a single number can't tell them apart.
Your reduction grade has exactly that blind spot. Retire a Critical and you've burned real fat — the program is genuinely healthier. Knock out a fistful of trivial Lows to make the percentage move and you've shed muscle: the number improved, your actual resilience didn't. An aggregate can lie by omission, and the most common lie it tells is about composition.
So I never report the grade alone. I report it the way a smart scale reports weight — next to the body-composition readout: a count of open Critical and High residual risks beside the percentage. And I apply one hard gate:
🚨 No register grades above C while a single Critical remains open — no matter how flattering the percentage.
You can drop fifteen pounds and still be carrying the visceral fat that's the actual threat — the dangerous mass a dumb scale can't see and a smart one flags in red. Reduction efficacy and absolute danger are different readings. The scorecard has to respect both.
Where it gets genuinely useful: the portfolio and the trend line
The single-register version is handy. The real payoff arrives when you scale it.
🔷 Across the company. Aggregate modeled risk and the reduction grade across every register — security, privacy, operational, vendor — for a portfolio view. The band-ceiling denominator keeps wildly different registers on a common, normalized scale, so a 12-risk vendor register and a 60-risk infrastructure register can share a chart without one drowning the other. It's the BMI move: normalize against size the way BMI normalizes weight against height, so a tall register and a short one finally become comparable.
🔷 Across time. This is what executives actually feel. Track total residual and the reduction grade quarter over quarter, year over year. A residual line trending down and a grade trending up is direct, defensible evidence the program is working — the closest thing to an "are we winning?" gauge a security function ever gets. With one catch, which is large enough to deserve its own section.
The discipline it demands: hold your inherent baseline and your scoring conventions stable between periods. Move the goalposts mid-season, and your trend line is measuring bookkeeping, not security.
So what changed since the last weigh-in?
Here's the catch. It's the same one the smart scale runs into the second time you step on it: you are not the same body you were last month, and your register is not the same register it was last quarter. Risks get retired. New ones get identified. The population churns beneath the number — and a single net delta quietly blends three very different stories into one, told as if it were a single story.
Say last quarter's total residual was 205, and this quarter's is 175. Down 30. Good news? You genuinely cannot tell yet, because that −30 is hiding at least three separate things:
🔹 Reduction in the risks you already had — your controls drove residual down on the book you were already carrying. This is the work. (Call it like-for-like: the same risks, measured twice.) 🔹 Risks that dropped off — a system decommissioned, a vendor retired, an exposure closed. Real, but it's attrition, not necessarily something your team did. 🔹 New risks that weren't there last time — and these push the number the other way. They're the five pounds the holidays put back on while you weren't watching.
Report the net, and you've told the board nothing they can trust. Report the bridge and you've told them everything:
Last quarter we were carrying 205 points of residual risk; this quarter, 175. That 30-point drop isn't one story, it's three — our controls removed 45 points from the risks we already had, retiring and closing risks took off another 10, and we identified new risks worth 25 points, four of them High or above, now on the book and already reflected in the 175.
Three honest sentences instead of one flattering one. (Retail figured this out decades ago — it's why nobody trusts total sales without same-store sales sitting right next to it.)
And here's the part that matters more than the arithmetic, because it's about culture rather than counting: finding a new risk is not a failure. A new line in the register usually means your visibility improved, not that your security worsened — somebody looked harder and surfaced something that had been in the dark. Build a metric that punishes the team for raising their hand, and you've built a machine that rewards blindness and quietly trains everyone to stop looking. So I grade the reduction on the known book, and I report newly surfaced risk in the open, beside it — never netted away, never held against the people who found it. The smart scale doesn't scold you for discovering a marker you didn't measure last time. It just adds the reading and keeps drawing the line.
The honest part
Let me say plainly what this model is not, because pretending otherwise would betray the whole spirit of the thing:
🔹 The scores are ordinal, not cardinal. A 20 is not twice as bad as a 10 — real severity is closer to exponential — so the absolute total has no physical meaning. 🔹 The sum is granularity-sensitive. Split one risk into three and your number balloons; merge them and it shrinks. Hold row granularity steady, or you're measuring your own spreadsheet habits. 🔹 It's vulnerable to Goodhart's law — the principle that a measure stops being a good measure the moment it becomes the target. Make "percent reduced" the goal, and people will farm easy, low-severity wins instead of grinding down the hard Critical: shedding muscle to move the scale. Which is precisely why the grade never travels without the open-Critical count, and the severity mix beside it.
None of these flaws is fatal. They're the toll you pay for turning a qualitative, color-coded inventory into something you can graph, grade, and defend.
So, is your risk actually going down?
Box was right — the model is wrong. The scores don't translate into anything physical, and a determined optimist can game any denominator I've described. But it's useful: it converts a static, red-amber-green inventory into a line on a chart that goes the right way and a grade you can defend to people who can smell a rigged number.
All models are wrong. Some are gradeable.
If you've been answering the board's question with a gut feel, score the reduction this quarter and grade it. The first number is humbling. Every number after it is progress you can prove — not the risk you have left, but the work you actually did to get there.
Now you can show your work.
Thanks for staying with me through a dense one — I know risk math isn't anybody's beach read. If you grade your own register and the methodology breaks in a way I haven't accounted for, that's exactly the feedback I want. Let's sharpen it together.
Views are my own.